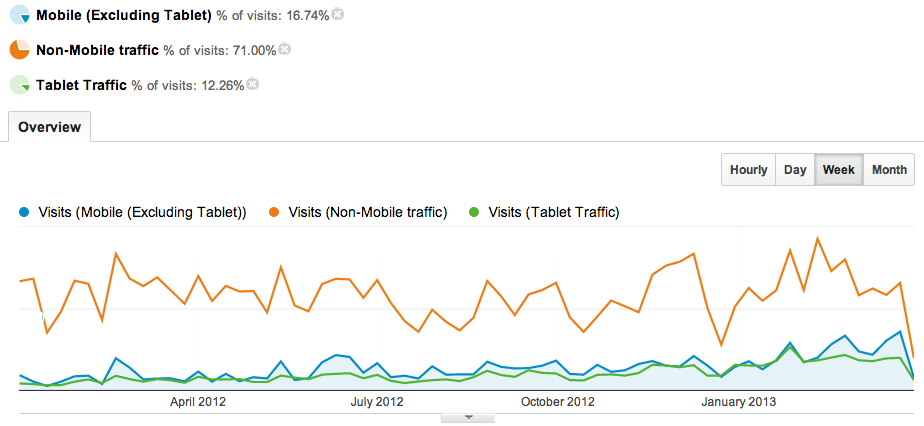
The Google Analytics chart below is just one that shows massive growth in mobile traffic across our projects over the last year. We’re now seeing upwards of 25% of activity come from mobile for many sites, and if the trend continues that figure will be heading towards 50% by the end of 2013. Extraordinary.
Of course, this puts mobile centre frame for strategic thinking here at Loft HQ. And this means we need data – reliable, useful data – to help us focus our efforts in the right places, and inform decisions across all our disciplines.
Google Analytics has a Mobile section under Audience, which provides a little insight, but it’s not really giving us the level of detail we need to make the recommendations that help our clients see off the competition. For that, we need to be able to drill down into the detail of mobile behaviour, compare to other user groups, make some changes, and monitor the results carefully.
Here’s a few tips on this for the new and unwary…
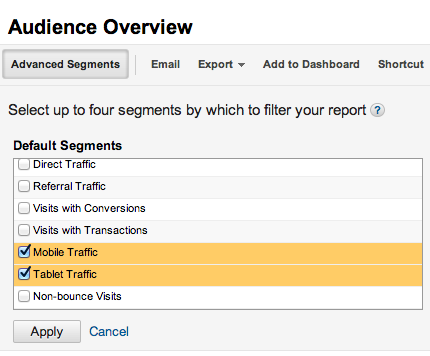
1. Use Advanced Segments
Just about wherever you are in Google Analytics, there’s an Advanced Segments button right under the report title. Down towards the bottom of the list, you’ll see two valuable options: Mobile Traffic and Tablet Traffic. Select these and click Apply to see your top content, user journeys, conversion points and other key metrics for mobile/tablet users.
It’s easier to compare these values to the overall if you also select the top segment – “All visits” – which by definition represents 100% of your visitors.
2. But watch out – “Mobile” here means mobile and tablet
This can get you in a pickle if you find yourself adding 10% of traffic from tablet and 25% from mobile to a grand figure of 35%. That’s misleading, since the mobile figure includes tablet.
Annoying, yes.
To make your business judgement calls, you really need to separate out mobile and tablet – and you can use Custom Segments to do this. Under Advanced Segments, click on the New Custom Segment option over on the right.
Enter “Mobile (Excluding Tablet)”, and set up the following two rules:
[Include] [Mobile (Including Tablet)] [Exactly matching] [Yes]
[and]
[Exclude] [Tablet] [Exactly matching] [No]
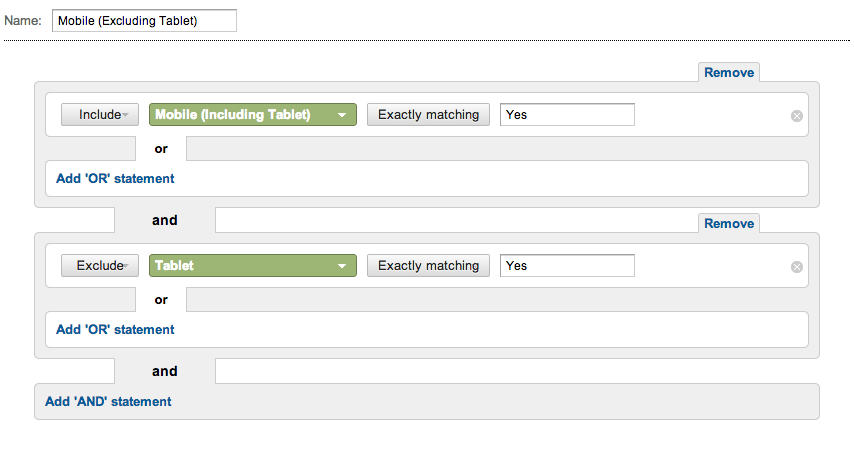
Save your segment, and can tick it in your Custom Segments box to see your updated reports – now you can see your mobile-only metrics. Amazing to see the differences in how your visitors behave when you break mobile out compared to tablet.
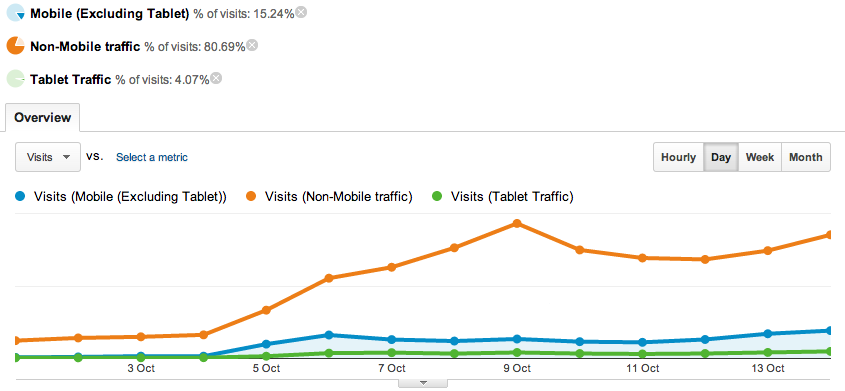
3. Filter out non-mobile traffic
But if you really want to compare how your visitors behave on mobile versus tablet versus normal computer, of course you need to break those figures out too – the All Visits segment bundles them all together of course.
This is easily fixed following the same method. Set up a new Custom Segment named “Non-Mobile Traffic”, with the following rule:
[Include] [Mobile (Including Tablet)] [Exactly matching] [No]
Save, select it and view your reports. Now you can see separate facts and figures for tablet, mobile (not tablet), and everyone else.
4. Finally…
Don’t forget to add this to your dashboard, and set up automated weekly emails so you get the stats in your inbox.